


From flying blind to fully in control.

The complete finance function, built into your brand in 90 days. Here’s exactly how.

Book a discovery call

30 minutes · no prep · no cost

What I actually do

The 90 days build one connected system. Five parts, each with a specific job, working together so nothing slips through. Here’s exactly what each one does.

Books & Data Foundation

Clean, automated numbers you can trust

Most brands come to me on cash-basis books built for taxes, not decisions. So I rebuild the foundation everything else stands on.

What I do:

  • Move you from cash to accrual, structured by channel
  • Automate the data from every channel into clean books
  • Handle inventory and COGS properly, so margin is real
  • Route bills through one system that files them for you

I build the automation myself, so you skip the expensive per-channel software. Clean books, done lean.

  • QuickBooks
  • Xero
  • Make
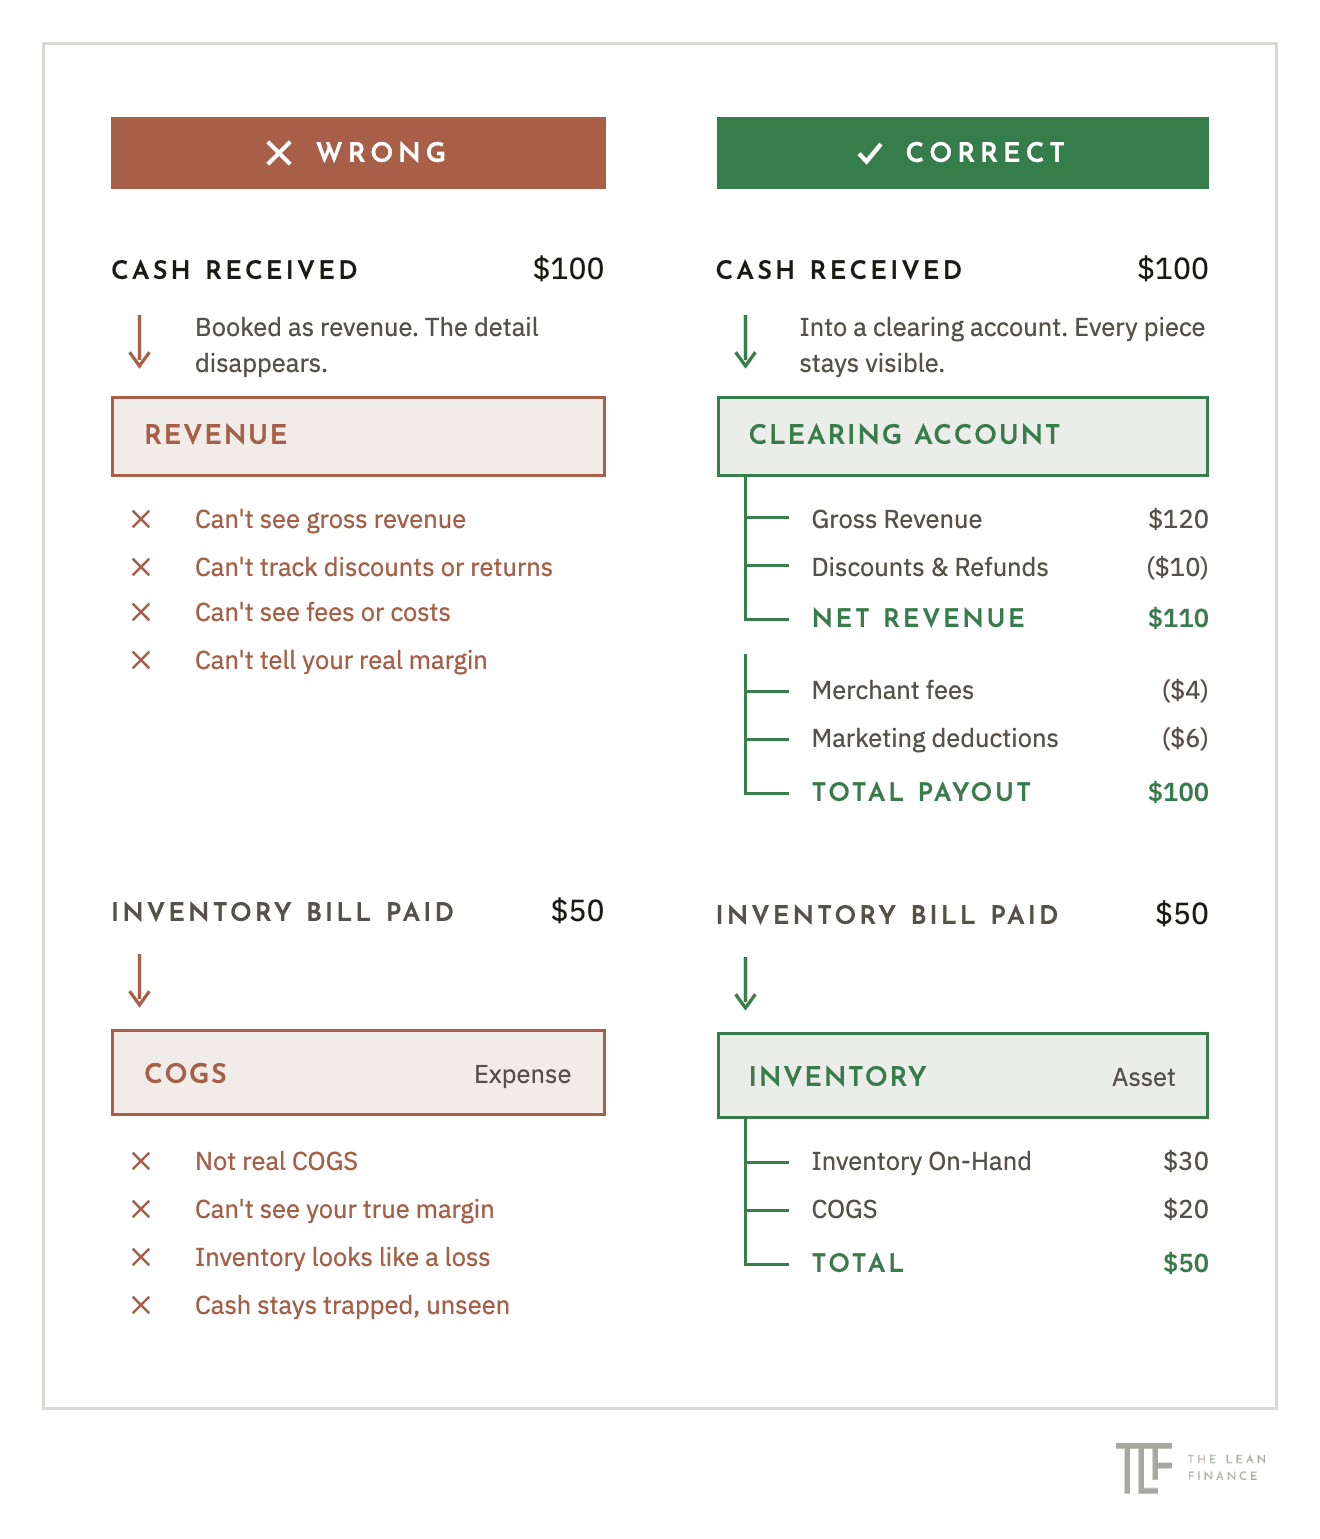
Diagram comparing wrong and correct bookkeeping. Wrong: a $100 cash receipt is booked straight to revenue, so you can't see gross revenue, discounts or returns, fees or costs, or your real margin; a $50 inventory bill is booked to COGS as an expense, so it's not real COGS, hides your true margin, makes inventory look like a loss and keeps cash trapped and unseen. Correct: the $100 receipt goes into a clearing account showing gross revenue $120, discounts and refunds ($10), net revenue $110, merchant fees ($4), marketing deductions ($6) and a total payout of $100; the $50 inventory bill goes to inventory as an asset, split into $30 on hand and $20 COGS.

Financial Model

A plan and clear targets

Most brands set targets month to month, with no long-term plan behind them. So I build the plan first, then work back to this month.

What I do:

  • Set five-year targets for revenue, profit and cash
  • Split them into quarterly and monthly targets
  • Link them to how profit and cash flow are managed
  • Update the model every quarter with your actuals

The same model is investor-ready, with funding requirement, use of funds and valuation built in. One plan, for running the business and for raising money.
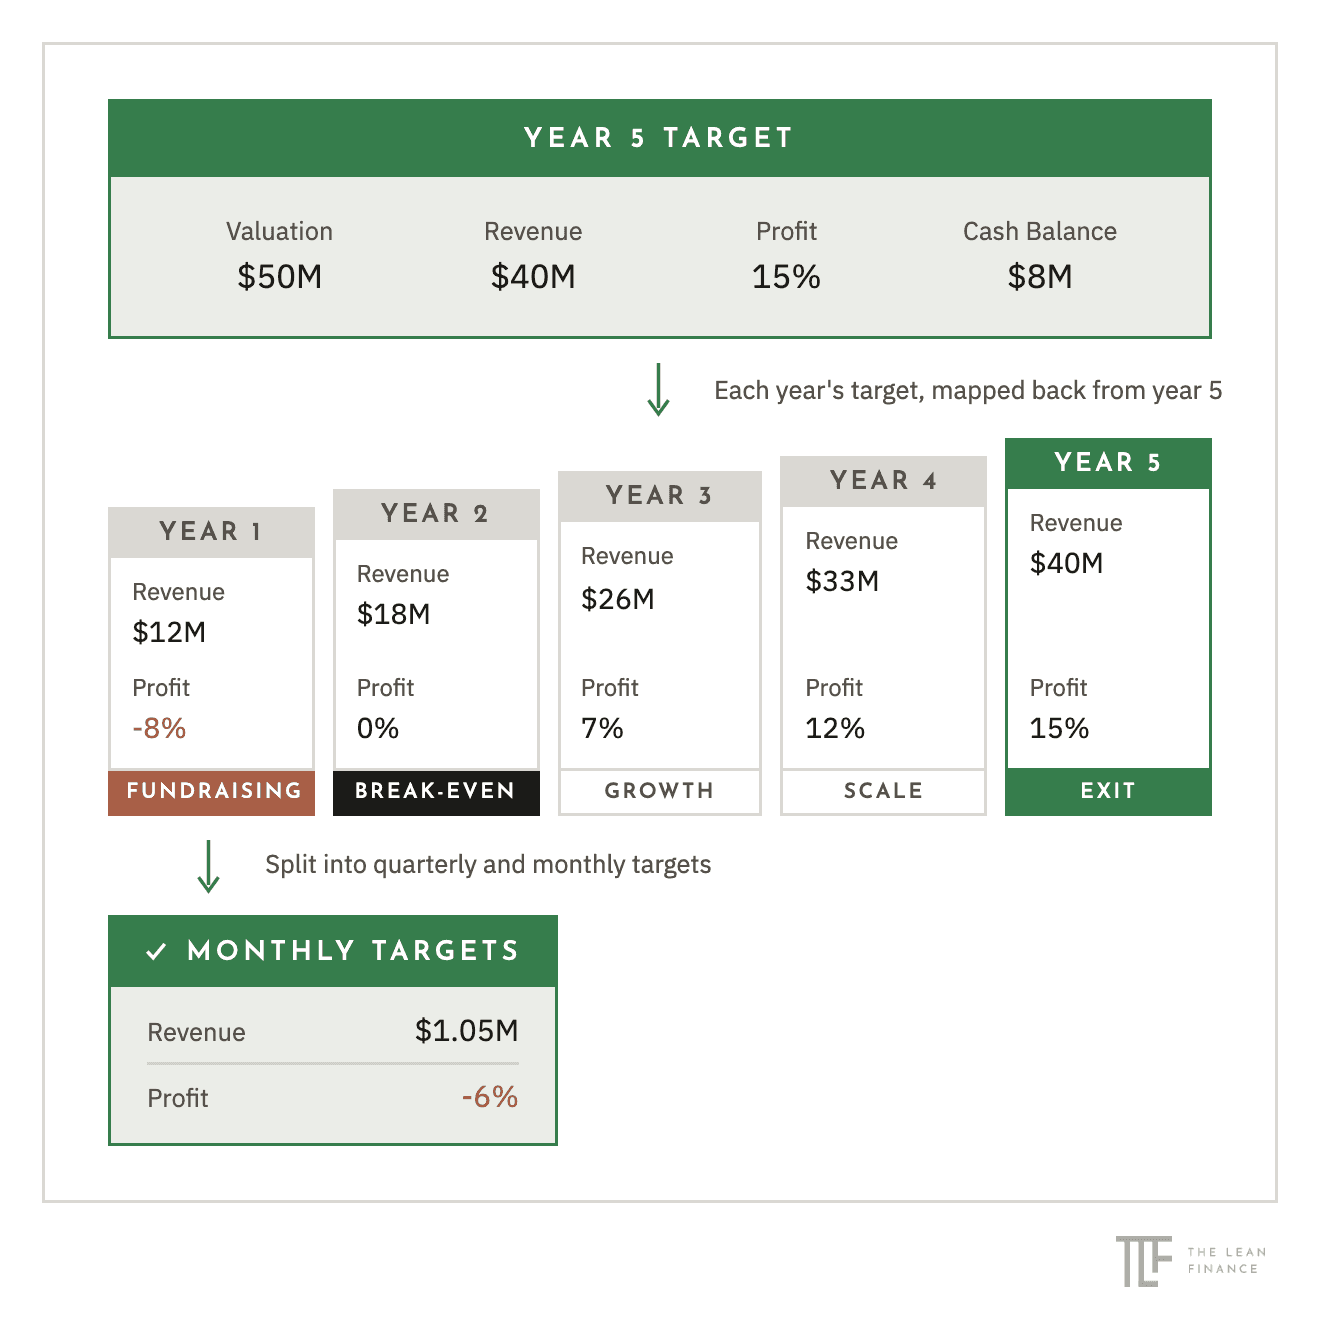
Diagram of a year 5 target cascading into yearly, quarterly and monthly targets. Year 5 target: $50M valuation, $40M revenue, 15% profit, $8M cash balance. Each year's target is mapped back from year 5: Year 1, fundraising, $12M revenue, -8% profit; Year 2, break-even, $18M revenue, 0% profit; Year 3, growth, $26M revenue, 7% profit; Year 4, scale, $33M revenue, 12% profit; Year 5, exit, $40M revenue, 15% profit. That is split into quarterly and monthly targets, shown as a monthly targets example of $1.05M revenue and -6% profit.

Profitability

Know which channels make you money

Revenue by channel is easy to see. What each channel actually earns is not. So I break your profit down channel by channel, after every cost.

What I do:

  • Build a contribution margin cascade for every channel
  • Show which channels generate cash and which consume it
  • Track MER against break-even and profit targets, per channel
  • Benchmark overhead and bring it back in line

Then I show you where to move spend and where to cut, so profit improves fast. Reviewed monthly, with a quick weekly read for early signals.
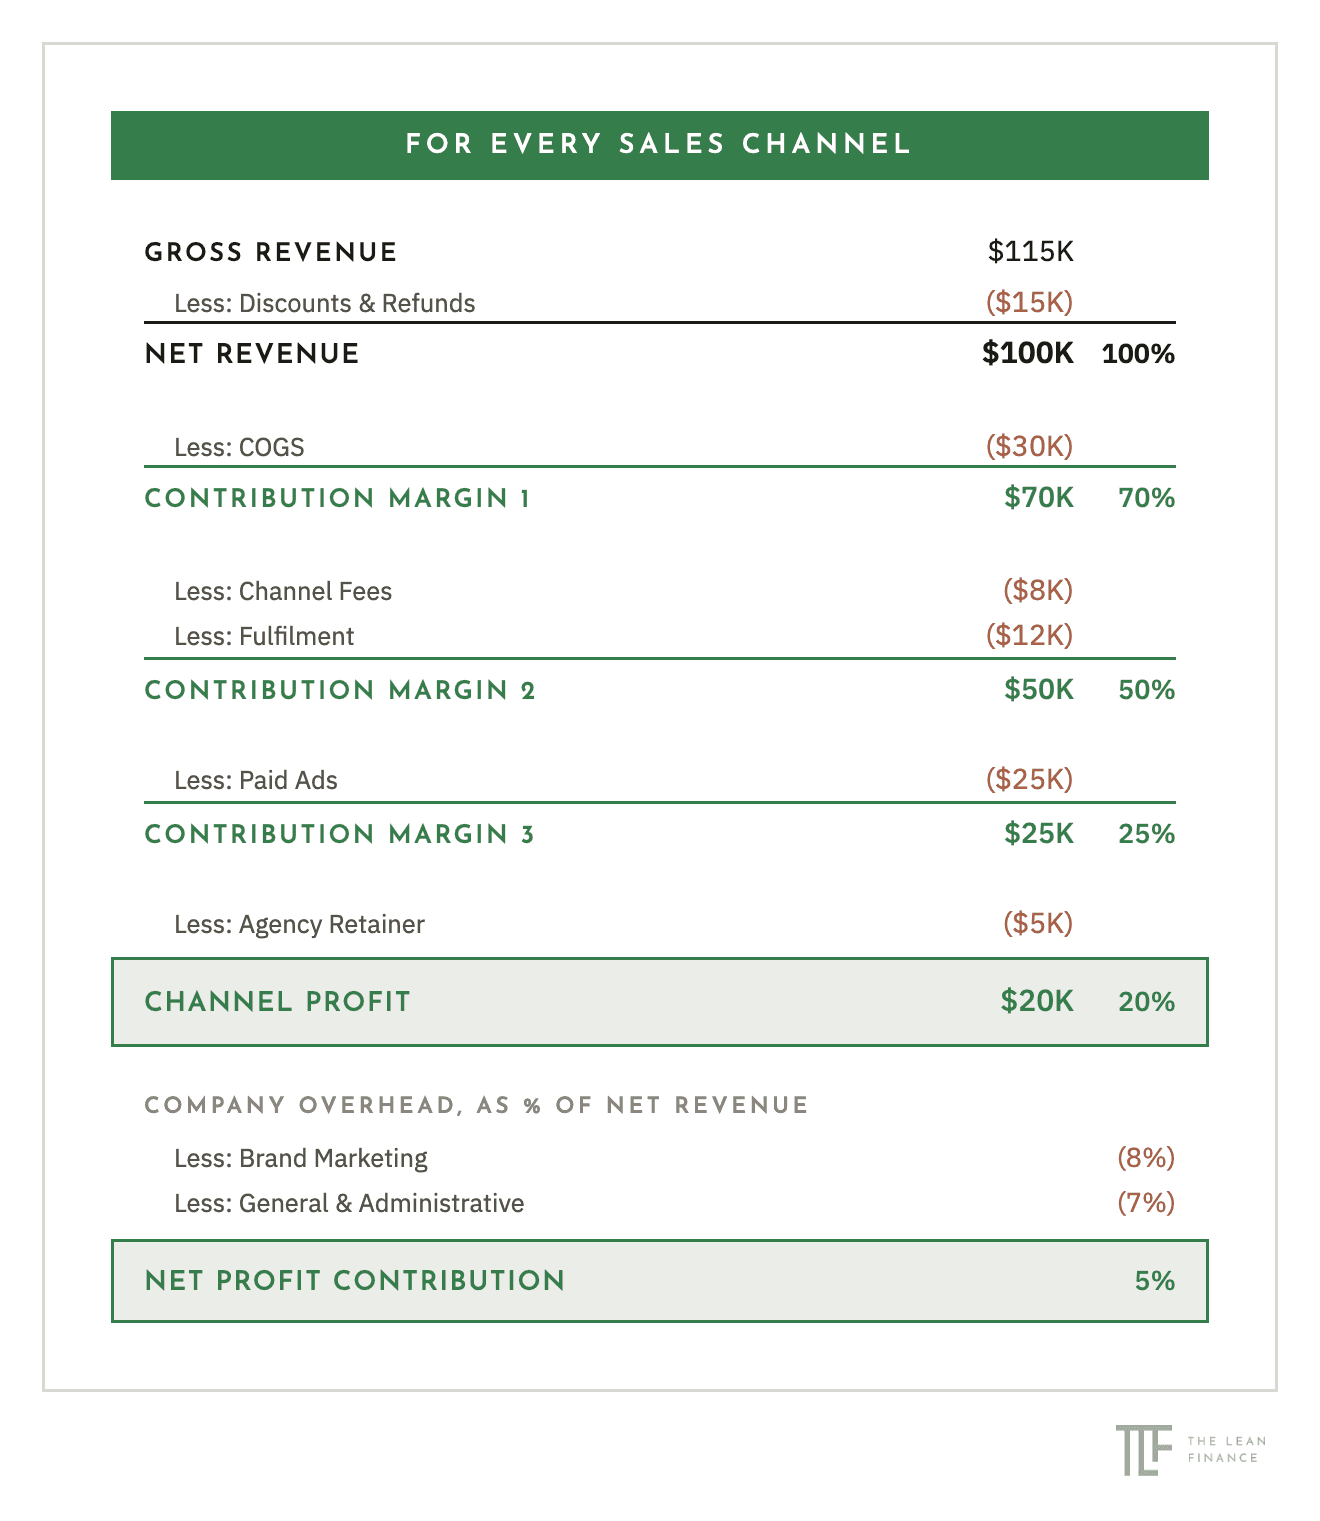
Contribution margin cascade for every sales channel. Gross revenue $115K, less discounts and refunds ($15K), net revenue $100K (100%). Less COGS ($30K), contribution margin 1 is $70K (70%). Less channel fees ($8K) and fulfilment ($12K), contribution margin 2 is $50K (50%). Less paid ads ($25K), contribution margin 3 is $25K (25%). Less agency retainer ($5K), channel profit $20K (20%). Company overhead as a percent of net revenue: less brand marketing (8%) and general and administrative (7%), net profit contribution 5%.

Cash Flow

Find the cash locked in your business

Growth eats cash. It sits in stock, waits on customers, goes out early to suppliers, and leaks into interest. So I find where yours is locked, and free it up.

What I do:

  • Clear aged stock and time new purchases
  • Negotiate longer supplier payment terms
  • Track receivables and collect overdue invoices
  • Plan every loan repayment and renegotiate terms

All of it runs through one rolling cash flow forecast, so you always know what cash you’ll have, and when.
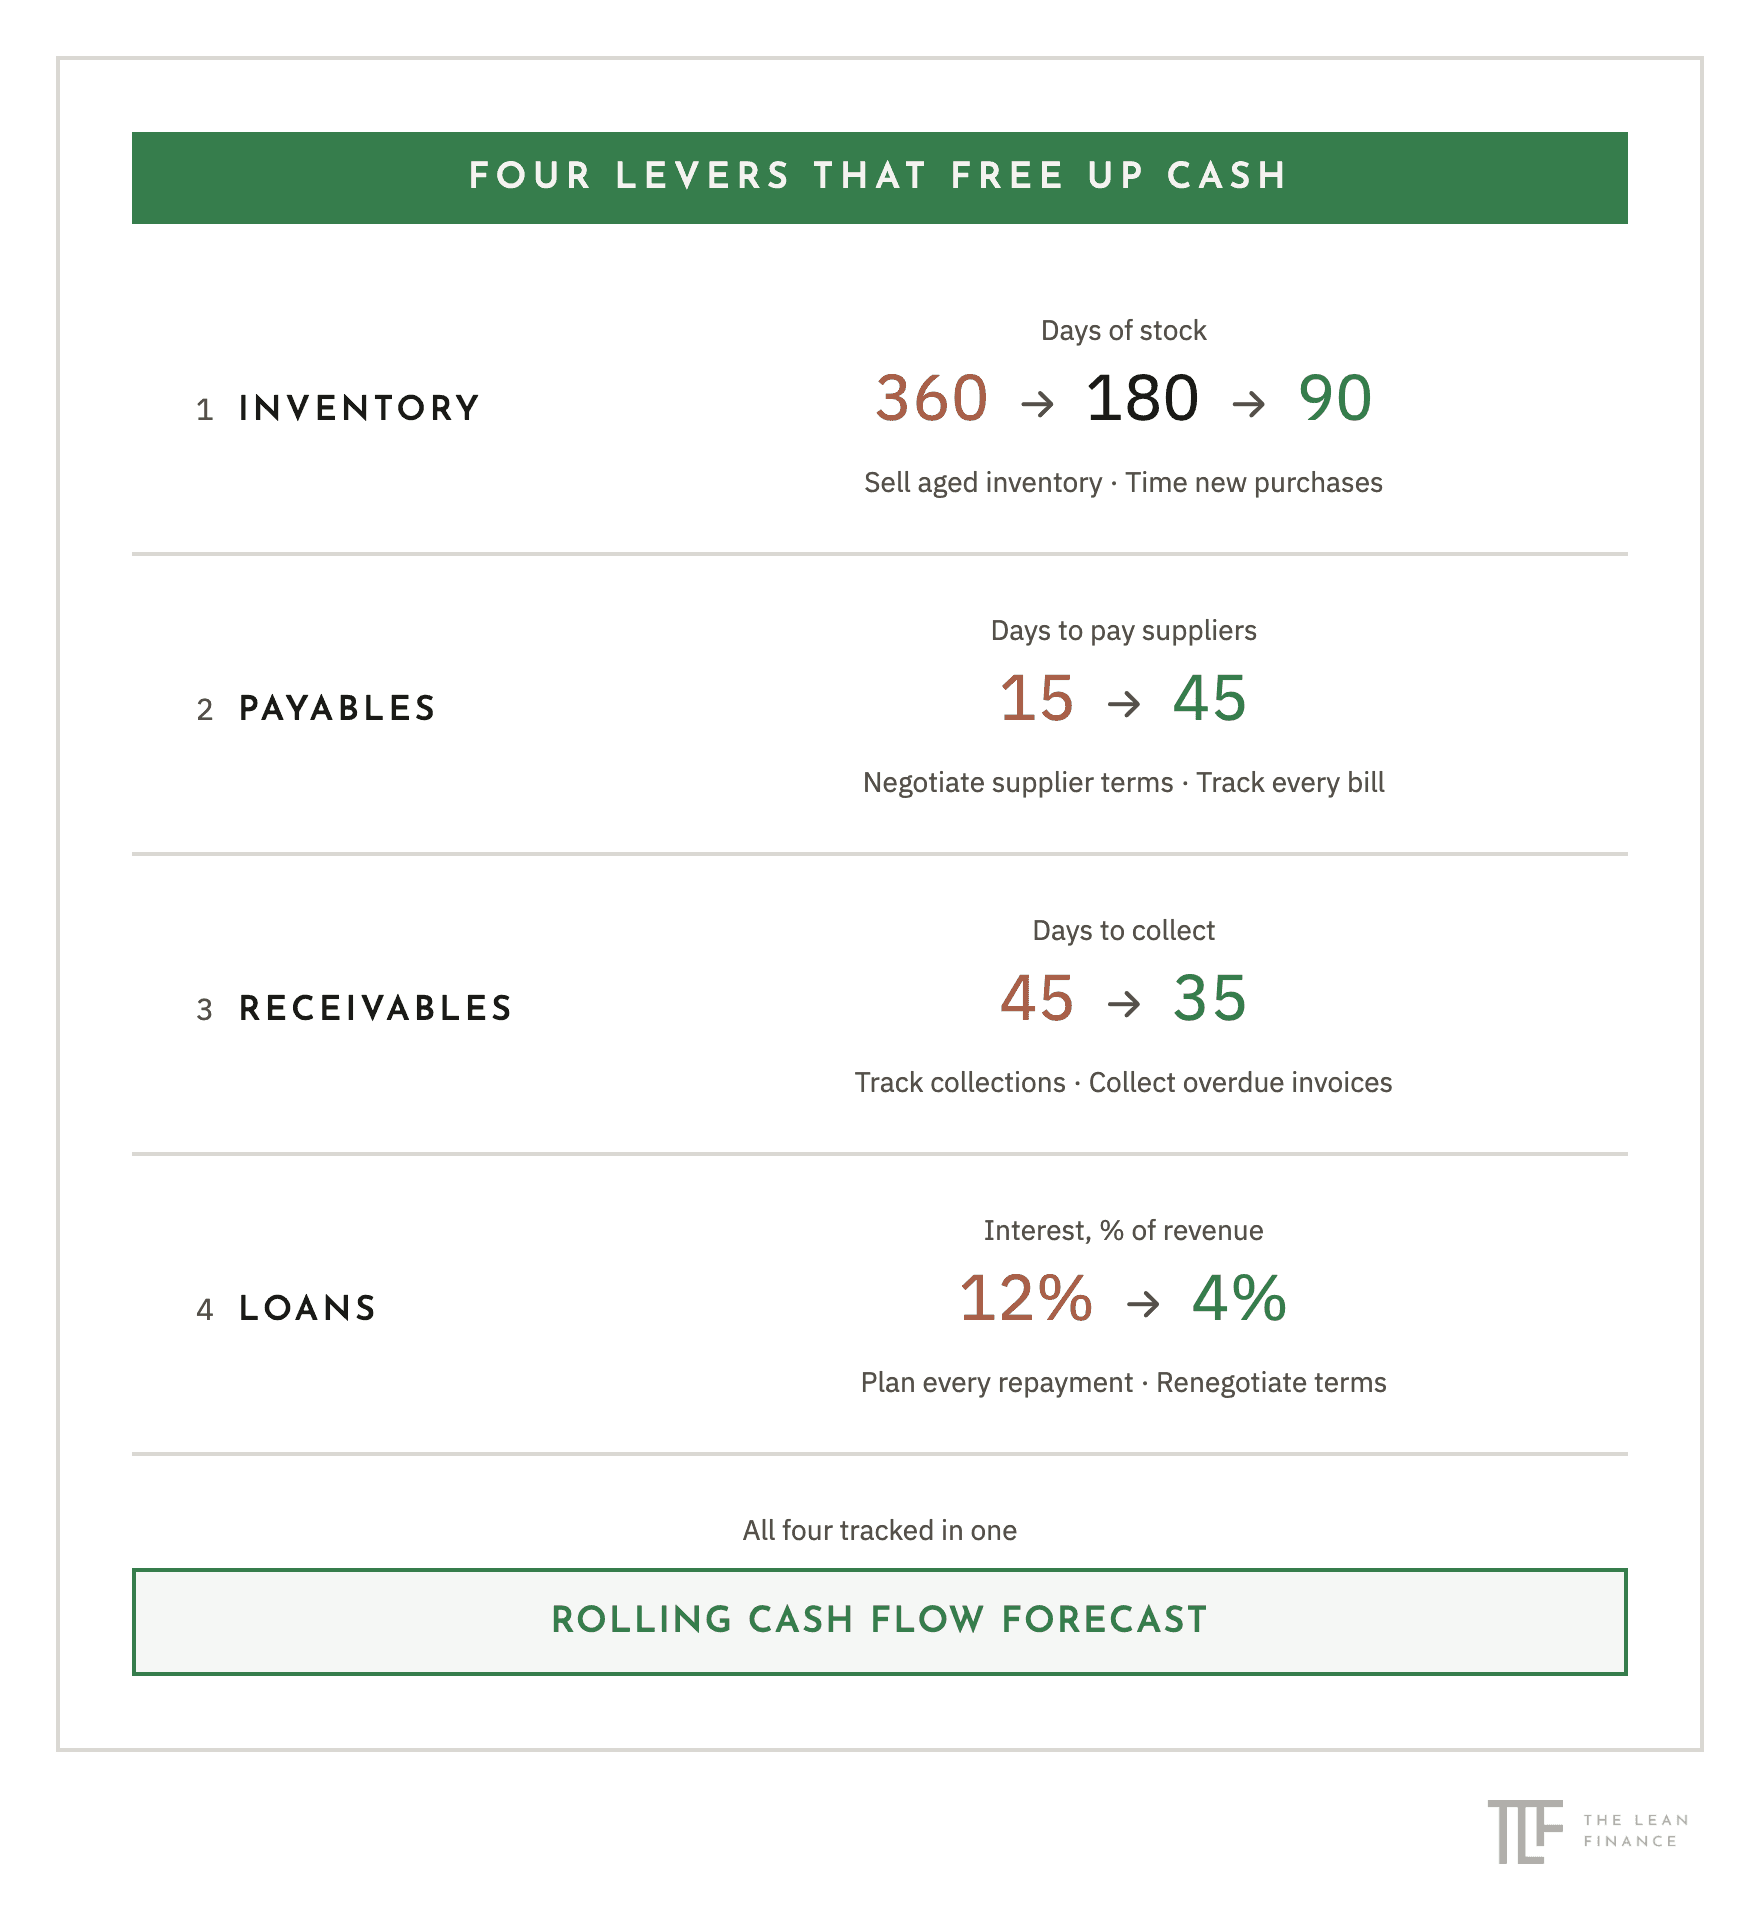
Four levers that free up cash. Inventory: days of stock reduced from 360 to 180 to 90, by selling aged inventory and timing new purchases. Payables: days to pay suppliers extended from 15 to 45, by negotiating supplier terms and tracking every bill. Receivables: days to collect reduced from 45 to 35, by tracking collections and collecting overdue invoices. Loans: interest as a percent of revenue reduced from 12% to 4%, by planning every repayment and renegotiating terms. All four tracked in one rolling cash flow forecast.

Reporting

Know where you stand, every Monday

Know where you stand, every Monday

Analysis only helps if you see it and act on it. So every Monday morning you get one clear report on last week’s numbers, short enough to read over your coffee.

What I do:

  • Track every KPI against your monthly targets
  • Break results down by channel, week by week
  • Flag what’s off track, with a CFO comment on why
  • Decide next steps together on a weekly call

Plus live dashboards built into your profitability and cash flow tools, ready to download as PDF. No spreadsheets to dig through, just the numbers that need your attention.
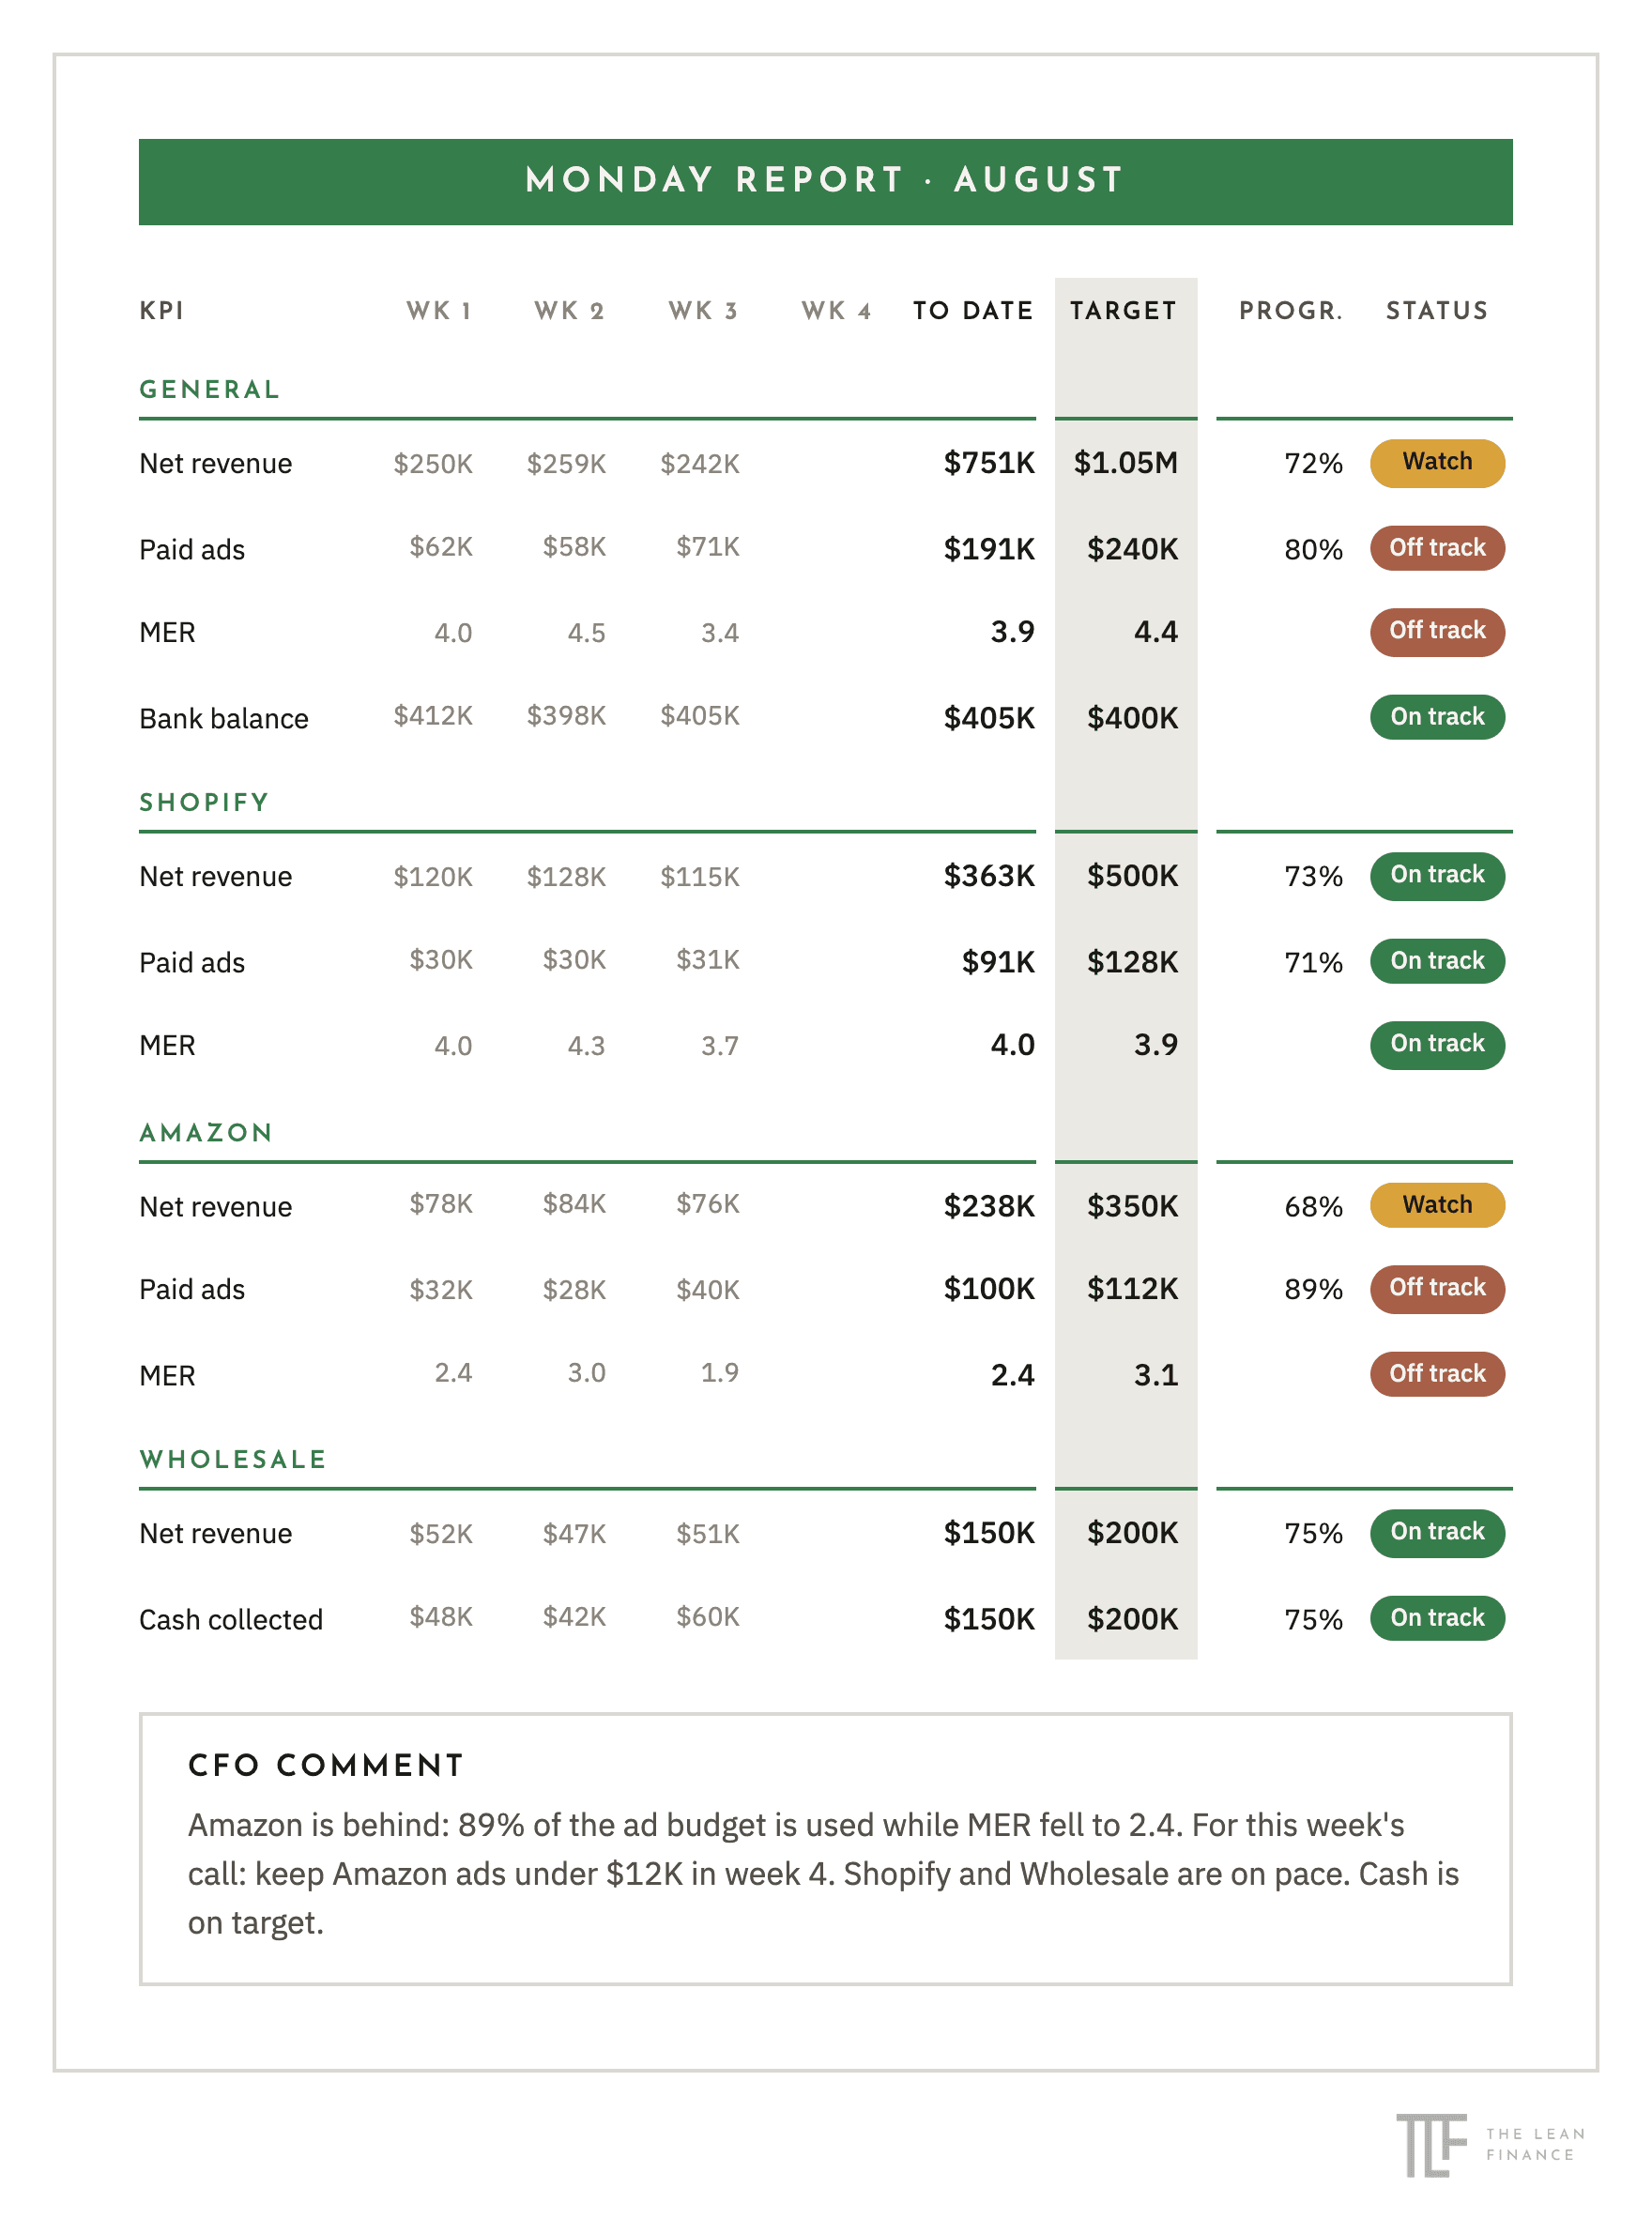
A Monday report for August: a KPI tracker by channel, each row showing weekly actuals, the total to date, the target, percent progress and a status of on track, watch or off track. General: net revenue $751K to date against a $1.05M target (72%, watch); paid ads $191K against $240K (80%, off track); MER 3.9 against a 4.4 target (off track); bank balance $405K against a $400K target (on track). Shopify: net revenue $363K against $500K (73%, on track); paid ads $91K against $128K (71%, on track); MER 4.0 against 3.9 (on track). Amazon: net revenue $238K against $350K (68%, watch); paid ads $100K against $112K (89%, off track); MER 2.4 against 3.1 (off track). Wholesale: net revenue $150K against $200K (75%, on track); cash collected $150K against $200K (75%, on track). CFO comment: Amazon is behind, with 89% of the ad budget used while MER fell to 2.4; this week's call is to keep Amazon ads under $12K in week 4, with Shopify, Wholesale and cash all on pace.

See what this looks like for your brand.

Book a discovery call

30 minutes · no prep · no cost